
Displays and Data Recording - PLEX displays, data logging and data analysis products available from OBR
Dash displays and data logging from PLEX now availabe from OBR

Variations
| Model | Price in USD |
|---|---|
| Standard analysis software - no charge | |
| Pro version analysis software | 815 |
PLEX Data Analysis Software
Data Analysis Software
The new PLEX Data Analysis Software® is one of the easiest, fastest and most versatile data analysis & visualization solutions available. It is meant to shape the way racers benefit from logged data by saving time & enabling smarter decision making. The PLEX PDA-WIN’s intuitive UI and customization options helps one decipher complex engine, race, driver & tuning data by visualizing it in easy to interpret & compare graphs, tables and other analysis components.
Description
Customizable UI
User defined layout of tabs and panels with handy panel docking similar to latest Windows SW suite.
Easy File Comparison
Seamlessly switch between single and comparison view even for completely different file types such as a dyno run with a track lap.
Video File Synchronization
Sync and review you video data along with the log data to get additional information on driver performance and data context.
Fast Keyboard Shortcuts
Keyboard shortcuts for the main menu and panel functions speed up the set-up time and real-time analysis considerably.
Live Data Updating
Zoom levels & cursors are linked among all analysis panels/graphs allowing automatic rescaling & cross referencing of data.
CSV Data Import (pro-version only)
Take advantage of the Plex Data Analysis SW and use it to analyze data from any logging system (ECUs, dedicated loggers, etc).
Multiple Data Graphs & Reports
Line / navigation / XY graphs, histograms, gauges, track-maps, tuning maps, laps/runs reports, data values at cursor and more.
Built-in Project Database
Create and keep track of events, tracks, drivers, vehicles and engines for easy referencing and historical data tracking.
Smart Tuning Maps
Optimize your fuel and ignition maps by analyzing the log data in tuning maps with the same breakpoints as your ECU.
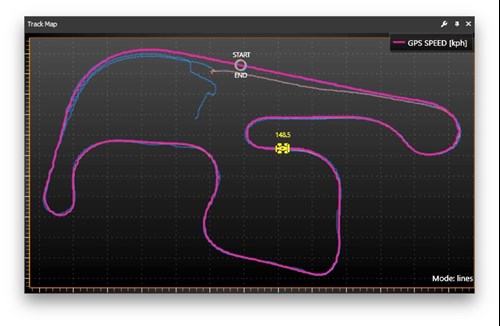
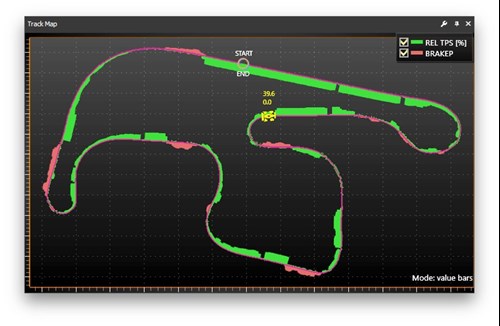
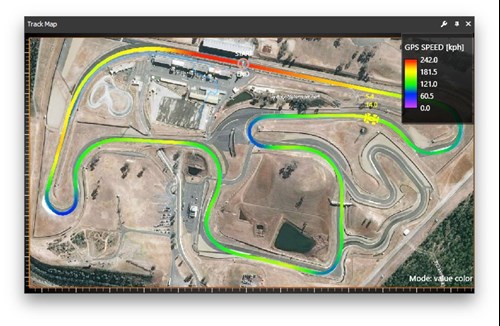
Autogenerated Track Maps
Use track maps to visualize the vehicle path and display data channel information along it. Display and compare different laps & sessions with the line mode or use the bars mode and add up to 2 data channels to visualize them along the vehicle path. For example, throttle position and brake pressure can be indicated with perpendicular bars clearly showing the driver inputs at each point on the track. An additional color mode allows displaying a single channel with a configurable color scale. All options can also be easily superimposed on satellite images.
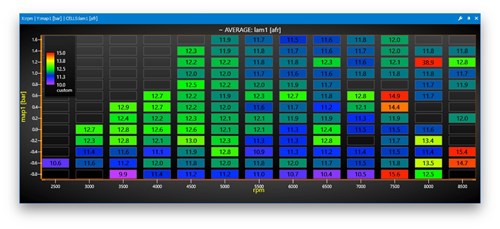
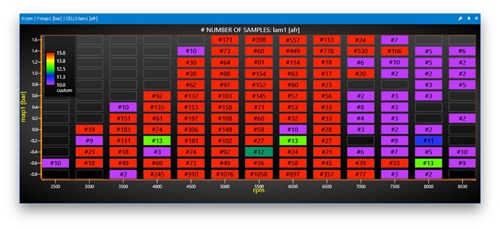
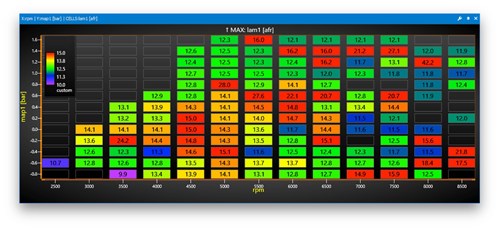
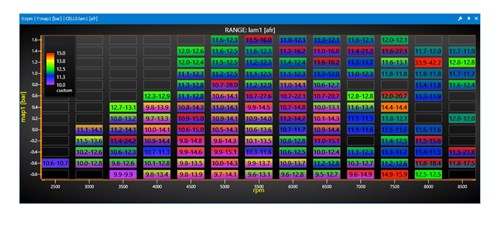
Tuning Maps
Tuning maps are special cell graphs designed to provide information directly transferable to the ECU calibration maps. They are used to display A/F ratio, closed loop fuel trim or knock retard. The map break points can be configured to be the same as the breakpoints used in the ECU maps and the cell size can be reduced to allow only data points close to the cell centers to be displayed. Users can easily change the display mode between average, number of samples, range, minimum and maximum.
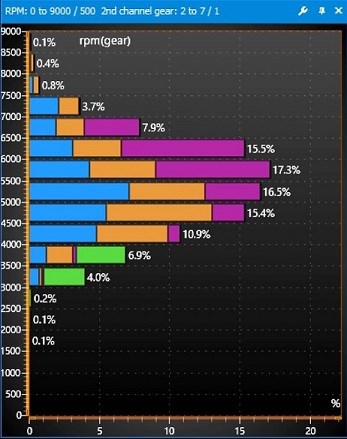
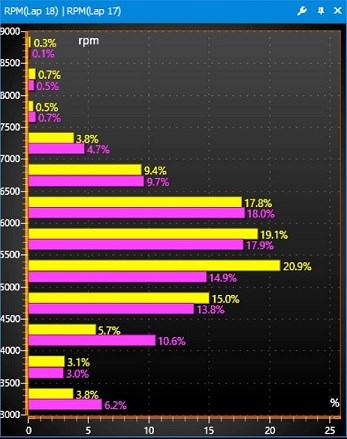
Generate Actionable Insights from Histograms
Histogram graphs display the frequency distribution of the the selected channel data. What’s the use? Looking at the time spent in each rpm range will indicate where in the range a performance increase would be more beneficial or it could indicate that a gearing change is required, whereas looking at the time spent in each throttle range might indicate inconsistent driving and ineffective use of the engine power. Alternatively, looking at suspension velocity histograms can help in determining the required spring and damping changes. These graphs use data from the currently selected part of the file and in comparison mode can show data from the whole laps/runs.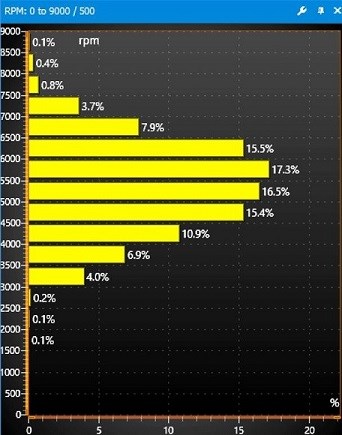
Analyze by Section
An automatic sections analysis report provides timing information for every track section in each lap/run. Consequently, the best times are used to calculate a theoretical best possible lap/run time.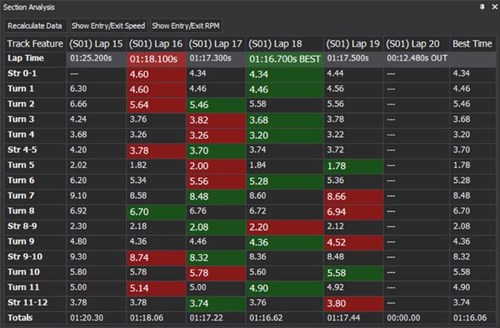
Auto Laps/Runs Table
The PDA-WIN auto detects laps/runs from all open sessions and displays them on a panel that can also be used to select the data range for viewing and comparing.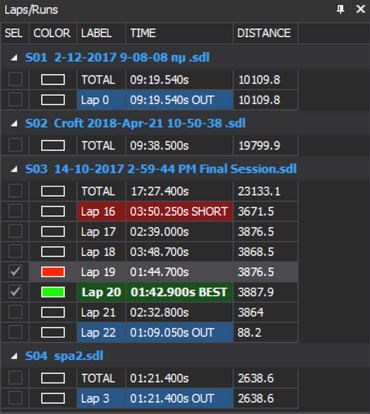
Synchronize any Video
Synchronize any type of video file by choosing a track reference point.
The video progress / display will then be linked to the other graphs both for replay mode and manual navigation.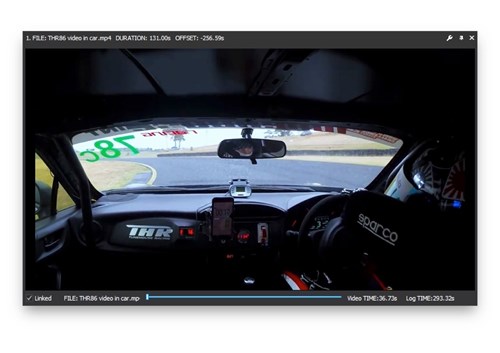
Simulate Driver Inputs
A driver’s inputs panel is designed to show the real-time driver actions at the current data point. Display gear, steering angle, throttle position, brake pressure & 2 additional channels.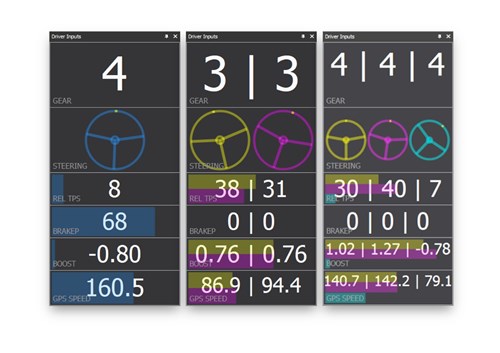
Version Comparizon
|
Version |
BASIC |
PRO |
||||
|
Compatibility |
PLEX Devices only |
All Devices via .csv File import |
||||
|
Price in $ excluding salex tax |
free |
from $815 |
||||
|
Layout |
||||||
|
Max. Number of Tabs |
3 |
16 |
||||
|
Multiple Instances of the Application |
- |
yes |
||||
|
Maximum Number of Loaded Sessions |
8 |
16 |
||||
|
Graph/Table Types |
||||||
|
Line Graphs |
yes |
yes |
||||
|
Navigation Maps |
yes |
yes |
||||
|
Track Maps |
2 |
yes |
||||
|
Events Table |
yes |
yes |
||||
|
Channel Values at Cursor Table |
yes |
yes |
||||
|
All Data Table |
yes |
yes |
||||
|
Bargraphs |
yes |
yes |
||||
|
Gauges |
yes |
yes |
||||
|
Status Indicators |
yes |
yes |
||||
|
Channel Statistics Table for Laps/Runs |
- |
yes |
||||
|
Histogram Graphs |
4 |
yes |
||||
|
Secondary Data Channel for Histograms |
- |
yes |
||||
|
Tuning Map Graphs |
2 |
16 |
||||
|
Max Channels on Tuning Map Graphs |
1 |
8 |
||||
|
XY Graphs |
4 |
16 |
||||
|
Max Channels on XY Graphs |
1 |
8 |
||||
|
Color Strip Graphs |
- |
yes |
||||
|
Video Panels |
1 |
6 |
||||
|
Other Functions |
||||||
|
Data Filtering for XY, Histogram & Tuning Map Graphs |
- |
yes |
||||
|
Floating Graph/Report Panels |
- |
yes |
||||
|
Linked Cursors & Zoom |
yes |
yes |
||||
|
Graph/report panels outside application (2nd screen) |
- |
yes |
||||
|
Arbitrary Comparison of File Sections |
- |
yes |
||||
|
Data Functions |
||||||
|
Channel Data Scale & Offset |
- |
yes |
||||
|
Math Data & Flag Channels per File & Global |
- |
yes |
||||
|
Import Functions |
||||||
|
PLEX SDL File import |
yes |
yes |
||||
|
AIM CSV File Import |
- |
yes |
||||
|
Generic CSV File Import |
- |
yes |
||||
|
Cobb, EcuTek, HPTuners CSV Import |
- |
yes |
||||
|
Racelogic VBO Log File Import |
- |
yes |
||||
|
Syvecs, LifeRacing CSV File Import |
- |
yes |
||||
|
DTA Dat File Import |
- |
yes |
||||
|
Analysis Functions |
||||||
|
Circuit Analysis: Lap Detection |
yes |
yes |
||||
|
Circuit Analysis: Automatic Sections |
yes |
yes |
||||
|
Circuit Analysis: Config. Sections with Real Time Calc. |
- |
yes |
||||
|
Circuit Analysis: Wheel Slip & Clutch Slip Calculations |
- |
yes |
||||
|
Circuit Analysis: Gear Change Event Detection |
- |
yes |
||||
|
Drag Analysis: Quarter Mile Run Detection |
yes |
yes |
||||
|
Drag Analysis: 1/2mi, 1mi, 1km, 0-100khp, 0-200khp, etc |
- |
yes |
||||
|
Drag Analysis: Wheel Slip & Clutch Slip Calculations |
- |
yes |
||||
|
Dyno Analysis: Steady State & Sweep Detection |
yes |
yes |